Evaluating ENTLN Performance Relative to TRMM/LIS
Rudlosky, S. D., 2015: Evaluating ENTLN performance relative to TRMM/LIS. J. Operational Meteor., 3 (2), 11-20.
Rudlosky (2015) compared three years (2011-13) of data from the Earth Networks Total Lightning Network (ENTLN) and the Tropical Rainfall Measurement Mission (TRMM) Lightning Imaging Sensor (LIS). The fraction of LIS flashes detected by the ENTLN was reported to improve our understanding of the ENTLN detection capabilities and enhance its use in weather research and operations.
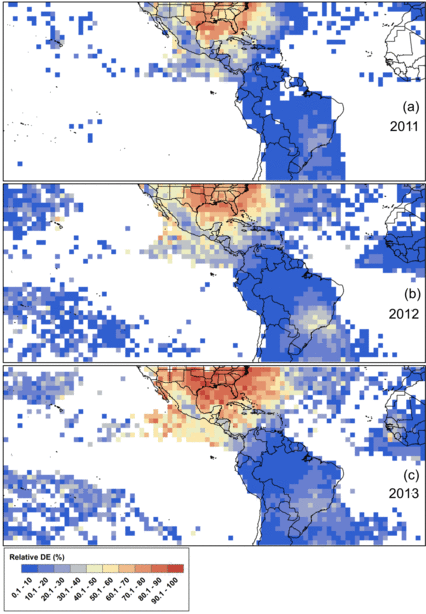
ENTLN performance improved between 2011 and 2013. Within the Western Hemisphere (38 N to 38 S), the relative flash detection efficiency (DE) increased from 21.6% during 2011 to 31.4% during 2013. Improved performance was evident in each of the geographical subdomains. The best regional performance occurred over the southern Contiguous United States (CONUS; south of 38 N), where the ENTLN detected 71.9% of LIS flashes during 2011-13.
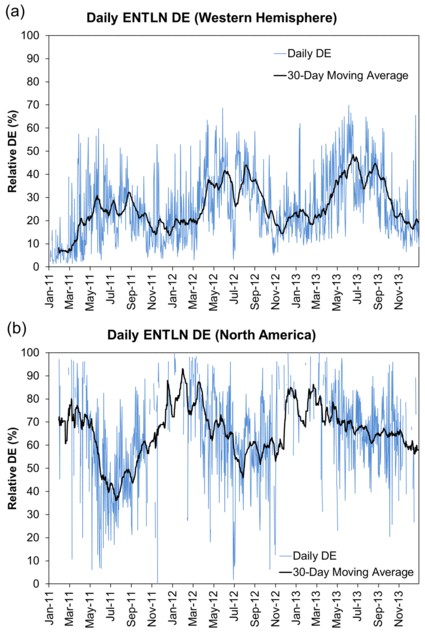
The most notable spatial feature was the expansion of the region surrounding CONUS with relative DE greater than 50%. The relative DE over the oceans also improved from 25.4% to 41.2% between 2011 and 2013. Performance improved in West Africa, and exhibited a local maximum in southeast Brazil during 2012. These findings illustrated the importance of sensor density for providing total lightning coverage. The daily relative flash DE generally exceeded 15% (50%) in the Western Hemisphere (North America), but large day-to-day variability was evident. Both meteorology and technology greatly influence these distributions, so future work must continually evaluate and understand the ENTLN performance.
The average distance (timing) offset between matched LIS flashes and ENTLN events was 10.8 km (+25.0 ms). Although the average timing offset was positive, the ENTLN reported its first event before 48.6% of LIS flashes began. The close proximity of matched flashes is important for GLM risk-reduction activities that seek to blend satellite- and ground-based lightning observations.
Multiple ENTLN events occurred during most matched LIS flashes. A single event occurred during 45.4% of matches, and the ENTLN detected an average 2.65 events for each matched LIS flash. This was much smaller than the average 10+ (50+) LIS groups (events) for each matched LIS flash. The ENTLN defined 51.3% (48.7%) of all matched LIS flashes as CG (IC), but ambiguity remains in the accuracy of this IC/CG classification. Within 200 km of CONUS, an average of 3.53 ENTLN events occurred during each matched LIS flash, and the ENTLN classified 28.9% (71.1%) of the matches as CG (IC).
Data from the National Lightning Detection Network (NLDN) helped characterize flash type (IC versus CG), and allowed investigation of the LIS characteristics of IC and CG flashes. This comparison also provided important insights into the ambiguity of flash classification in both datasets. LIS flashes were subset into six categories based on their ENTLN IC/CG classification and whether they were observed by each network. Overall, 17.0% of LIS flashes within 200 km of CONUS were characterized as Confirmed CG, 20.7% were Ambiguous IC, 8.1% were Ambiguous CG, 26.1% were Confirmed IC, 24.0% were Unmatched, and 4.1% were NLDN Only.
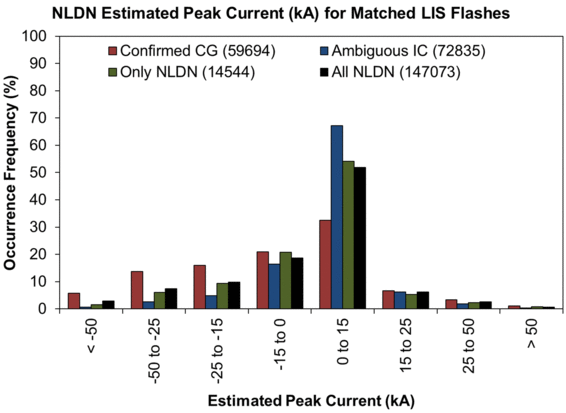
The ENTLN detected the most intense LIS flashes, and the LIS characteristics also indicated that CG flashes transfer more charge than IC flashes. The Unmatched flashes were smallest (197.3 km2) and had the shortest average duration (5.1 ms), indicating they were weakest. The Confirmed CG flashes were largest (428.4 km2) and lasted longest (24.0 ms), while only the Unmatched flashes were smaller and shorter than the Confirmed IC flashes. 67.2% of the Ambiguous IC flashes had NLDN estimated peak currents in the ambiguous weak +CG range (0-15 kA), suggesting that this group consisted mostly of IC flashes, with some true CG flashes mixed in. The maximum number of events per group (MNEG) and maximum group area (MGA) were much larger for Confirmed CG flashes (14.9 and 378.4 km2) than for Confirmed IC flashes (7.7 and 200.4 km2).
Results suggest that the ENTLN provides the broad area coverage required for many weather research and operational applications. This study should help Earth Networks better characterize their network performance, and provide researchers and forecasters with important insights as the operational use of these data continues to grow. Future studies should seek to determine which combinations of space- and ground-based lightning observations best characterize lightning flashes and their destructive potential.

|
Figure 3. Estimated peak current reported by the NLDN for matched LIS flashes. Confirmed CG flashes are defined as CG by both the ENTLN and NLDN, Ambiguous IC flashes are defined as IC by the ENTLN but CG by the NLDN, Only NLDN are observed by the NLDN but not the ENTLN, and All NLDN is all LIS flashes observed by the NLDN. NLDN flashes with peak current between 0-15 kA typically are discarded as ambiguous or misclassified weak positive cloud-to-ground flashes (many are actually intra-cloud).
|
|

|
Figure 1. Spatial distributions of ENTLN relative flash detection efficiency (DE) during 2011 (panel a), 2012 (panel b), and 2013 (panel c). The relative flash DE is computed by dividing the sum of the "matched" LIS flashes by the sum of "all" LIS flashes within 2x2 degree grid cells. White areas indicate grid cells with fewer than 15 LIS flashes.
|

|
Figure 2. Average daily ENTLN relative flash detection efficiency (DE; blue line) for (a) the Western Hemisphere between 38 N and 38 S and (b) for North America (includes land masses of southern CONUS, Mexico, Central America, and the Caribbean Islands). The black lines represent 30 day moving averages, and days with fewer than 15 LIS flashes are omitted (only occurs in panel b).
|
|


