GLD360 Performance Relative to TRMM LIS
Rudlosky, S.D., M.J. Peterson, and D.T. Kahn, 2017: GLD360 Performance Relative to TRMM LIS. J. Atmos. Oceanic Technol., 34, 1307-1322, doi:10.1175/JTECH-D-16-0243.1.
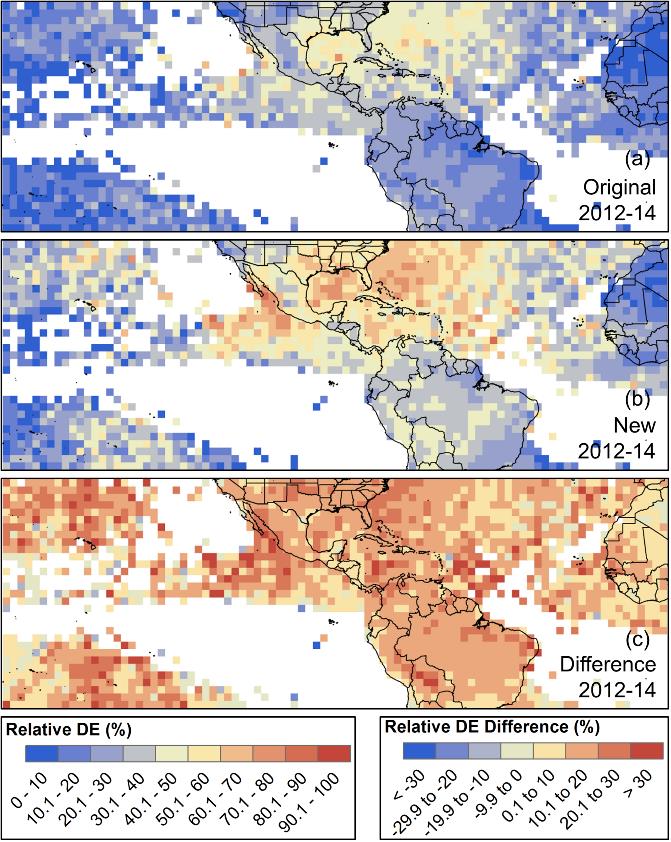
The recent GLD360 upgrade motivated analysis of the operational GLD360 dataset alongside data that have been reprocessed using the upgraded algorithms. There is a clear increase in the fraction of LIS flashes detected by the GLD360 between the operational and reprocessed data. The relative DE improvement appears during each year in every region, and year-over-year improvement also is evident in each region for both datasets. The reprocessed relative DE increases from 46.0% (2012) to 50.8% (2013) to 63.6% (2014) over North America. Algorithm changes alone cannot explain the improvement from year to year, but this observation is consistent with the improved performance of other ground-based lightning detection networks over time. Groundbased lightning data are provided by private vendors, who continually work to improve their networks by adding sensors, relocating sensors, improving hardware, and upgrading software. Consistent improvement between the operational and reprocessed datasets in all of the studied domains shows that the major GLD360 performance improvement is related to the algorithm upgrades and not hardware changes (e.g., the addition of sensors).
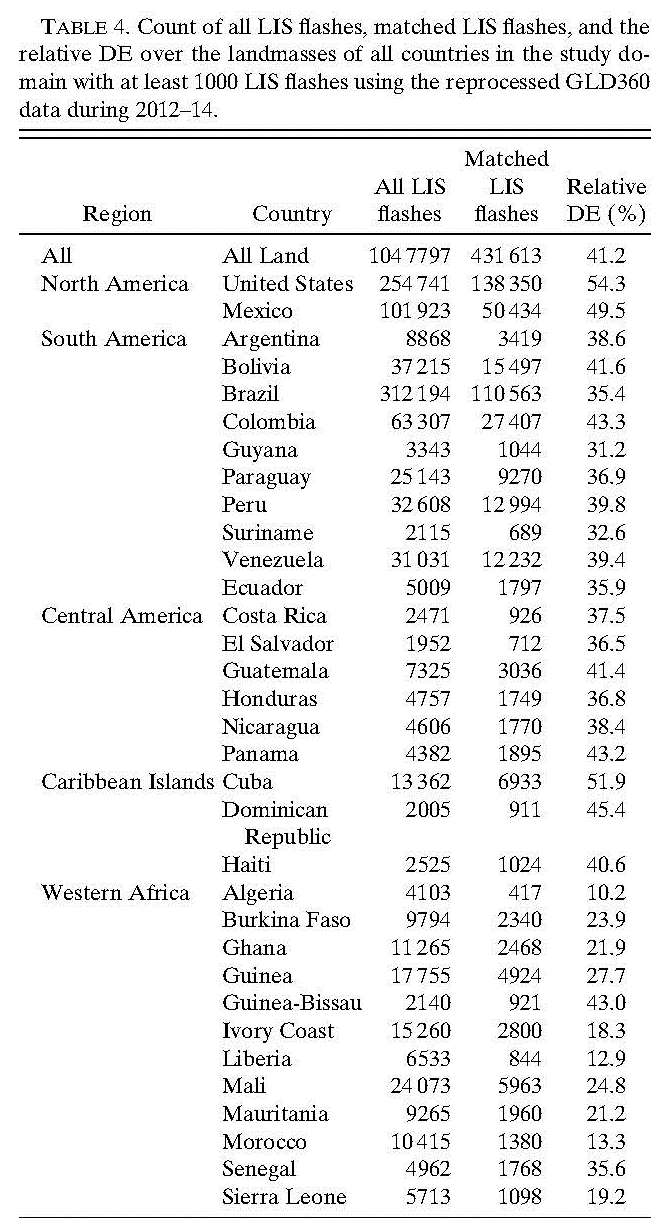
Broad geographic areas have relatively uniform GLD360 performance, but regional and interregional performance variability also exists. The best performance in North America, South America, Central America, the Caribbean Islands, and western Africa occurs in the United States (54.3%), Columbia (43.3%), Panama (43.2%), Cuba (51.9%), and Guinea-Bissau (43.0%), respectively. The reprocessed relative DE exceeds 40% throughout large portions of the study domain. During 2014, the region with relative DE exceeding 60% includes southern CONUS, the western Atlantic, the eastern Pacific, and the Gulf of Mexico. As previously shown for other VLF networks (e.g., Biswas and Hobbs 1990; Orville and Huffines 2001; Rudlosky and Fuelberg 2010; Orville et al. 2011; Said et al. 2013; Hutchins et al. 2013; Rudlosky and Shea 2013), the GLD360 relative DE is greater over the oceans (52.6%) than over land (41.2%). The GLD360 detects more than 60% of the LIS flashes over the National Hurricane Center Atlantic marine forecast areas, which supports use of the GLD360 for investigations of oceanic storms, especially tropical storms and hurricanes in the Atlantic basin.
Direct flash-to-stroke comparisons provide several important insights into the relationship between the ground- and satellite-based lightning observations. The GLD360 relative DE strongly depends on the LIS characteristics. The matched LIS flashes have more groups (14.5) and events (70.6), last longer (18.6ms), and are larger (379.3km2) than the unmatched LIS flashes (10.0, 41.3, 6.1 ms, 251.0 km2, respectively). For each LIS characteristic examined, the greater the value, the more likely the GLD360 is to observe the LIS flash. The LIS characteristics also increase with increasing GLD360 stroke count. Single-stroke flashes have the fewest LIS groups and events and are both shorter and smaller than the multistroke flashes. LIS flashes with four-plus related GLD360 strokes have the most groups and events and are the longest and largest LIS flashes. These findings show that lightning intensity is observable by both ground- and space-based lightning observation networks, albeit with different measures of intensity. While most present lightning-derived forecasting tools display the occurrence and frequency of lightning flashes, many additional lightning intensity metrics are descriptive of storm strength and morphology (e.g., Peterson and Liu 2013; Peterson et al. 2016).
Most of the matched LIS flashes have only one related GLD360 stroke (55.7%), but 44.3% (13.9%) of the matches contain two-plus (four plus) related GLD360 strokes. For LIS flashes with multiple GLD360 strokes, 57.3% contain subsequent strokes with greater Ip than the initial stroke Ip. Stronger subsequent strokes occur in 48.9%, 61.8%, and 68.2% of matched LIS flashes with two, three, and four-plus related GLD360 strokes, respectively. Zhu et al. (2015) showed that the mean first to subsequent stroke field peak ratio is 2.4 over Florida, and that 34% of multistroke flashes have at least one subsequent stroke whose field peak is greater than that of the first stroke. Poelman et al. (2013) found that the first stroke has a greater chance of being detected than the subsequent strokes because first strokes exhibited greater peak currents than the subsequent strokes in 57 negative CG flashes in Belgium. Strong initial strokes are even more likely over the oceans than over land. Cooray et al. (2014) suggested that higher cloud potentials are required to initiate ground flashes in maritime storms, and that lightning flashes initiated under higher potentials harbor larger first return stroke currents. The vast majority of multistroke flashes with first-stroke Ip between 210 and 110 kA contain stronger subsequent strokes. This suggests that the GLD360 sometimes observes the initial cloud pulses associated with flashes that eventually strike ground. Since the GLD360 does not differentiate between IC and CG strokes, additional research will be required to confirm this observation.
Analysis of the distance offsets between matched LIS flashes and GLD360 strokes reveals clear improvement in location accuracy in the reprocessed dataset. The mean (median) location difference improved from 11.1km (12.6 km) in the operational dataset to 9.5km (10.9 km) in the reprocessed dataset. For multistroke flashes, using the nearest GLD360 stroke in space (rather than the first in time) results in mean (median) location differences of 8.7km (7.0 km) for the reprocessed data. The similarity between the flash and stroke locations reported by the optical and radio systems is encouraging for GLM applications. The close proximity suggests that the GLD360 data can help validate the GLM, and future forecasting tools could benefit from the combination of ground- and space-based lightning observations.
|
|
Figure 1. Spatial distributions of the GLD360 detection efficiency relative to TRMM LIS flashes during 2012-14 using the (a) operational and (b) reprocessed data. The relative flash DE is computed by dividing the sum of the matched LIS flashes by the sum of all LIS flashes within 2 by 2 degree grid cells. (c) Illustration of the difference between the relative DE for each grid cell (reprocessed minus operational). White areas in each panel indicate grid cells with fewer than 15 LIS flashes.
|
|
|