Evaluating WWLLN Performance Relative to TRMM/LIS
Rudlosky S. D., and D. T. Shea, 2013: Evaluating WWLLN performance relative to TRMM/LIS. Geophy. Res. Lett., 40, 2344-2348, doi:10.1002/grl.50428.
Rudlosky and Shea (2013) compared 4 years (2009-2012) of data from the WWLLN and TRMM LIS. They determined the fraction of LIS flashes that were detected by the WWLLN to improve our understanding of WWLLN detection capabilities and enhance its use in research and operations. The results provide valuable information on the relationship between ground-based and satellite-based lightning observations, which will become increasingly important as the GLM launch approaches.
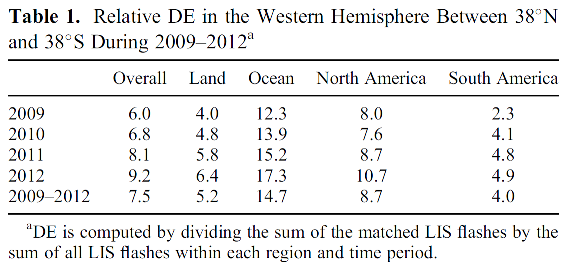
The manuscript described both the spatial and temporal variability of WWLLN performance. The WWLLN DE (relative to the LIS) steadily improved from 6% during 2009 to 9.2% during 2012 (i.e., in the Western Hemisphere, between 38_N and 38_S). Improving performance also was evident in each of the geographical subdomains (i.e., North America, South America, land, and oceans). The WWLLN was approximately three times more likely to detect LIS flashes that occurred over the oceans (17.3%) than over land (6.4%), and DEs greater than 20% occurred exclusively over the oceans. It performed twice as well over North America (10.7%) than over South America (4.9%). Further research will be required to investigate the meteorological and technological contributions to these observations.
An average of 1.5 WWLLN strokes occurred during each matched LIS flash, but 71.5% of matched flashes were single stroke. Multiple WWLLN strokes during individual LIS flashes suggest that the WWLLN detected multi-stroke flashes, the LIS optical pulse-to-flash clustering thresholds were too loose, or our distance (25 km) and time (330 ms) thresholds should be tightened. Each of these factors could have contributed to multiplicities greater than 1, but future research will be required to determine their relative influences.
Their analysis revealed that the WWLLN preferentially detects the strongest LIS flashes (i.e., those with more groups and events, longer durations, and larger horizontal extents). Both the MNEG and the MGA were larger for the matched LIS flashes than the non-matched flashes, so the matched flashes were more likely to contain return strokes (i.e., CG flashes). Since these networks detect different aspects of a lightning flash (i.e., optics versus sferics), the close spatial proximity (11 km) and temporal proximity (+62 ms) of matched flashes are encouraging for GOES-R risk reduction studies. Findings also suggest that the WWLLN will benefit post-launch GLM validation (i.e., characterizing its DE and location accuracy), especially over the oceans.
|
|
|
Figure 1. Spatial distribution of WWLLN DE during 2012 (a) and during 2009-2012 (b and c). DE is computed by dividing the sum of the matched LIS flashes by the sum of all LIS flashes within 2x2 km grid cells. The brightness is reduced for grid cells with fewer than 15 LIS flashes, and white areas indicate grid cells with no LIS flashes.
|
|
Figure 2. Distance (a) and timing (b) offsets between the 182,310 matched WWLLN and LIS flashes (2009-2012). The average (median) distance and time offsets are 11 km (10 km) and +62 ms (0 ms), respectively. Note that the upper limits are open in each panel (final columns) because WWLLN strokes can occur greater than 25 km from the radiance-weighted LIS centroid (i.e., within 25 km of any group) and longer than 300 ms into a LIS flash.
|
|