Lightning Resources
at CICS-MD


Lightning Jumps Often Preceed Severe Weather


Advances in lightning datasets and storm analysis techniques are improving our understanding of relationships between storm-scale processes and lightning production. The emergence and expansion of total lightning datasets hold great promise for researchers and operational forecasters. Darden et al. (2010) found that incorporating real-time total lightning data into severe weather forecasting procedures improved warning confidence, and suggested potential improvement in short-term warning lead times. However, they also noted the limited use of lightning information in the National Weather Service (NWS) convective warning program. They suggested that this was due to the lack of total lightning information at regional and national scales, limited knowledge about relationships between lightning and severe weather, and a cultural legacy of perceiving lightning data as less important than traditional radar and satellite products.

Lightning Visualization (Hover to Animate)

Many studies have shown that sudden increases in intra-cloud (IC) lightning flash rate, colloquially known as lightning jumps, often precede severe weather occurrence (e.g., Goodman et al. 1988, MacGorman et al. 1989, Williams et al. 1989, Williams et al. 1999, Buechler et al. 2000, Lang et al. 2000, Goodman et al. 2005, Wiens et al. 2005, Tessendorf et al. 2007, Steiger et al. 2007, Gatlin and Goodman 2010, Darden et al. 2010, Schultz et al. 2009, 2011). The lightning jump signature is a useful proxy for strengthening updrafts and increasing storm intensity, helping forecasters identify storms acquiring severe potential and determine where a storm is in its lifecycle (Darden et al. 2010). Lightning jumps also have been observed prior to severe hail and wind. For example, Goodman et al. (2005) examined a severe pulse thunderstorm that exhibited a strong increase in IC flash rate 9 min before damaging winds occurred at the surface. Gatlin and Goodman (2010) and Schultz et al. (2009, 2011) have quantified this relationship to develop lightning jump algorithms that provide an early indication (warning) of severe weather. Using lightning data alone, the algorithm described by Schultz et al. (2011) predicted severe weather with a 20.65 min lead time, a 79% probability of detection (POD), and a 36% false alarm rate (FAR).

Documenting Storm Severity in the Mid-Atlantic Region
using Lightning Radar and Sounding Information

Rudlosky S. D., and H. E. Fuelberg, 2013: Documenting storm severity in the Mid-Atlantic region using lightning and radar information. Mon. Wea. Rev., 141, 3186-3202.

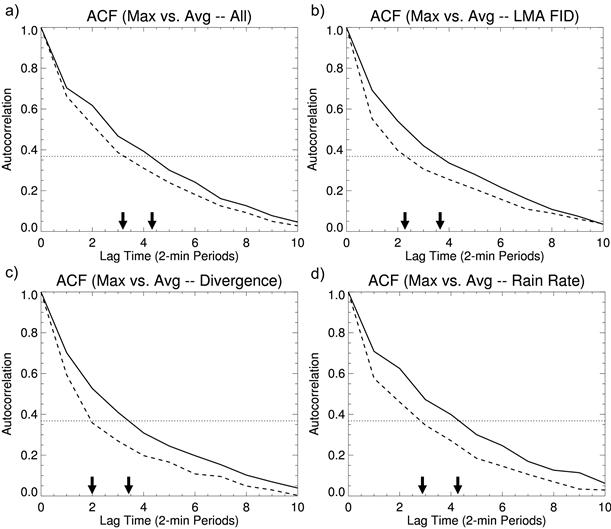
Rudlosky and Fuelberg (2013) examined more than 1200 severe and non-severe storms in the Mid-Atlantic region of the United States using total lightning, radar, and model-derived information. Automated Warning Decision Support System (WDSS) procedures were developed to create grids of lightning and radar parameters, cluster individual storm features, and data mine lightning and radar attributes from many storms. Serial correlation complicated the statistical analyses but also provided an opportunity to examine the persistence of storms. Decorrelation times were found to vary by parameter, severity, and mathematical operator (i.e., average versus maximum storm values). Average storm values are more persistent than maximum storm values, and both lightning and radar parameters are more persistent in severe storms than non-severe storms. Another important finding is that source-based lightning mapping array (LMA) products (e.g., vertically integrated LMA; VILMA) are more persistent than flash-based LMA products. Despite these differences, the vast majority of decorrelation times are between 3-6 lags, suggesting that consecutive 2-min storm samples (following a storm) are effectively independent after only 6-12 min.

The development and implementation of lightning jump algorithms motivated an analysis of lightning jumps alongside radar-derived parameters in severe and non-severe storms. Adding a simple flash rate threshold (10 flashes min-1) to the 2? lightning jump algorithm (Schultz et al. 2009, 2011) reduces the fraction of non-severe storms exhibiting jumps from 76.4% to 53.7%. The 2? algorithm (with threshold) yields 0.92 jumps h-1 in non-severe storms and 1.44 jumps h-1 in severe storms. Less than 15% of lightning jumps in severe storms exhibit LMA flash rates between 10-25 flashes min-1, versus more than 35% having greater than 85 flashes min-1. On average, lightning jumps in severe storms have greater total LMA flash rate (totLMA), change in flash rate with time (DFRDT), and maximum expected size of hail (MESH) than lightning jumps in non-severe storms. Furthermore, ~2% (~35%) of lightning jumps in severe storms exhibit MESH values less than 5 mm (greater than 25 mm). Less than 30% of all lightning jumps with MESH smaller than 5 mm occur in severe storms, whereas more than 60% of lightning jumps with MESH values larger than 5 mm occur in severe storms. Applying a 10 mm MESH threshold to the 2? lightning jump algorithm further reduces the fraction of non-severe storms exhibiting a jump from 53.7% to 37.2%, and decreases the frequency of jumps in non-severe storms from 0.92 jumps h-1 to 0.61 jumps h-1. Results also indicate that the automated WDSS tracking procedures produce very few erroneous jumps.

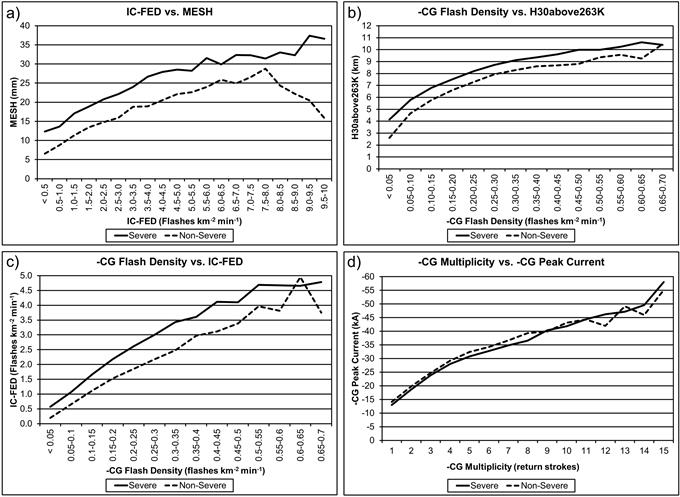
The storm database provided additional insights into the distribution of lightning and radar characteristics in severe and non-severe storms. For example, average storm values are more representative of climatology than maximum storm values. Severe storms are larger, last longer, and produce stronger radar-derived parameters and greater LMA and negative cloud-to-ground (-CG) flash rates than non-severe storms. Severe wind-only and hail-only storms appear less intense on average than the severe wind plus hail and tornadic storms. Severe hail-only storms exhibit the lowest mean 30 dBZ echo top (Top30dBZ) and the smallest LMA and -CG flash rates. Conversely, severe wind-only storms have greater LMA and -CG flash rates, and much greater -CG multiplicity and estimated peak current than severe hail-only storms. Although most radar parameters are comparable in wind plus hail and tornadic storms, the tornadic storms exhibit much greater LMA and -CG flash rates.

Figure 1. Autocorrelation functions for average storm values (solid) and maximumstorm values (dashed) for (a) all lightning and radar products listed in Table 1, (b)LMAflash initiation density (LMA FID (c) storm-top divergence, and (d) rain rate. Decorrelation times (i.e., when the autocorrelation drops below 1/e; horizontal dashed lines) are marked with arrows on the horizontal axis. Results show that average storm values (solid) are more persistent than maximum storm values (dashed).

Figure 2. Profile histograms comparing (a) LMA-FED vs MESH (mm), (b) -CG flash density vs H30above263K (km), (c) -CG flash density vs LMA-FED, and (d)-CG multiplicity (return strokes) vs estimated -CG peak current (kA). The ordinate displays the mean of all values in each corresponding bin, and the solid (dashed) lines represent all 2-min severe (nonsevere) storm centroid points. For example, in (a) the average MESH is 12.5mm for severe storms with LMA-FID , 0.5 flasheskm^2 min^1.

Correlation coefficients and profile histograms demonstrated storm-scale relationships between CG and LMA characteristics, and between lightning and radar parameters. For example, both LMA flash extent density (LMA-FED) and -CG flash density are directly related to the MESH. This finding further illustrates the dependence of lightning occurrence on updraft strength. Flash-based LMA products are better correlated with CG lightning and radar-derived parameters than are source-based LMA products, indicating that accurate LMA flash counts are required to relate lightning production to storm structure, evolution, and severity. Correlations also were shown between -CG flash density, multiplicity, and estimated peak current; and estimated positive CG (+CG) peak current was found to be inversely related with various lightning and radar-derived measures of storm intensity.

Results suggest that the LMA, NLDN, and radar datasets complement one another, and that their combination might help improve the discernment of storm severity. However, our preliminary findings illustrate complex relationships that will require physical explanations and confirmation outside the Mid-Atlantic States. Both the ongoing dual polarization WSR-88D upgrade and future launch of the GOES-R Geostationary Lightning Mapper (GLM; Goodman et al. 2008) will improve insights into storm-scale processes and the discernment of storm severity. Our future research will continue to examine which combinations of lightning and radar parameters provide clues about the development and evolution of severe storms as we work to incorporate near-storm environment information and radar-derived parameters into operational lightning jump algorithms.