Lightning Resources
at CICS-MD


Idealized Conceptual Model of a Cloud-to-Ground
Lightning Flash as Observed by the DCLMA and ENTLN

3-D Depiction of the IC Pulses and CG Strokes reported by
the ENTLN relative to DCLMA Observations

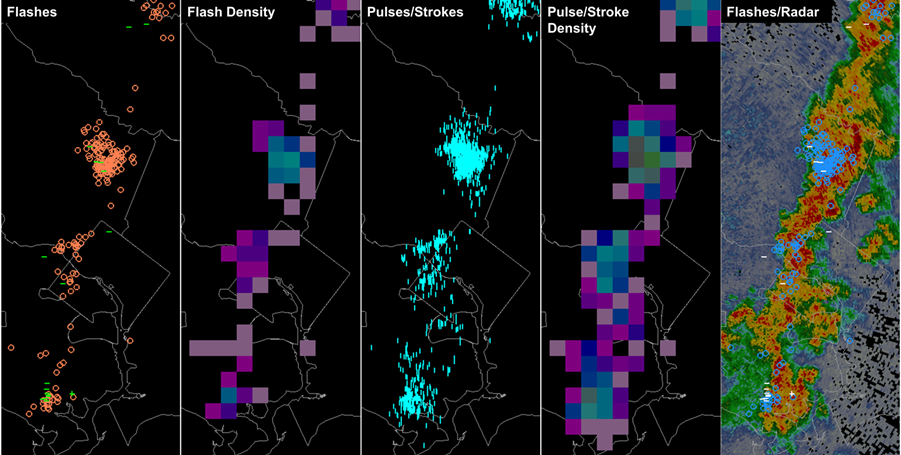
This single cloud-to-ground (CG) lightning flash originated ~27,000 feet above Falls Church, VA, covered nearly 150 square miles, and struck ground 10 miles to the northeast near Silver Spring, MD, well outside the parent thunderstorm. This CG flash contained 15 ENTLN reported intra-cloud (IC) pulses and 1 ENTLN reported CG stroke.

Several hundred LMA sources were combined into single lightning flash (black line). The ENTLN reported a CG flash that contained 15 IC pulses and 1 CG stroke (red dots). The IC pulses better depict the spatial extent of the flash, but the ENTLN typically does not report the full spatial extent of lightning flashes due to the separation distances between its sensors.

Conceptual Model Discussion


The images above depict a single cloud-to-ground lightning flash as observed by the ENTLN and LMA. The ENTLN reports the location and time of some fraction of cloud-to-ground (CG) strokes and intra-cloud (IC) pulses (accurate to within a few hundred meters). Alternatively, the Washington D.C. Lightning Mapping Array (DCLMA) provides detailed 3-D observations of lightning channels (accurate to within 10's of meters) within ~150 km of D.C.

Until recently, legacy lightning datasets available in AWIPS displayed only the CG flash locations. In the above example, a CG flash would appear as a minus sign south of Silver Spring, MD, with no indication that this flash had originated 10 miles away in Falls Church, VA. The IC pulse information from ENTLN reveals more of the flash than a single CG point. The IC pulses better depict the spatial extent of the flash, albeit with less precision than the LMA. Note that the ENTLN has a very dense network surrounding Washington D.C., and the network may have detected many fewer IC pulses had the flash occurred in a region with fewer sensors (e.g., South Dakota). Regardless, this example reveals the utility of visualizing the components of lightning flashes (pulses/strokes) rather than viewing them as individual flashes.

When pulse/strokes are viewed as individual points, there is an upper limit above which distinguishing the quantity of pulses/strokes becomes impossible. This motivated the development of lightning density products which better depict the intensity of IC and/or CG lightning. Lightning densities signify the number of flashes, strokes, and pulses in a grid cell over a given period of time (units of flashes, strokes, or pulses per km2 per min). The frequency of lightning flashes is often indicative of storm intensity (especially IC flashes). The densities are provided at varying spatial and temporal resolutions to accommodate a variety of users. The lightning point data also can obscure other datasets, so the lightning density grids provide many more opportunities for viewing lightning data alongside more traditional radar and satellite parameters.